
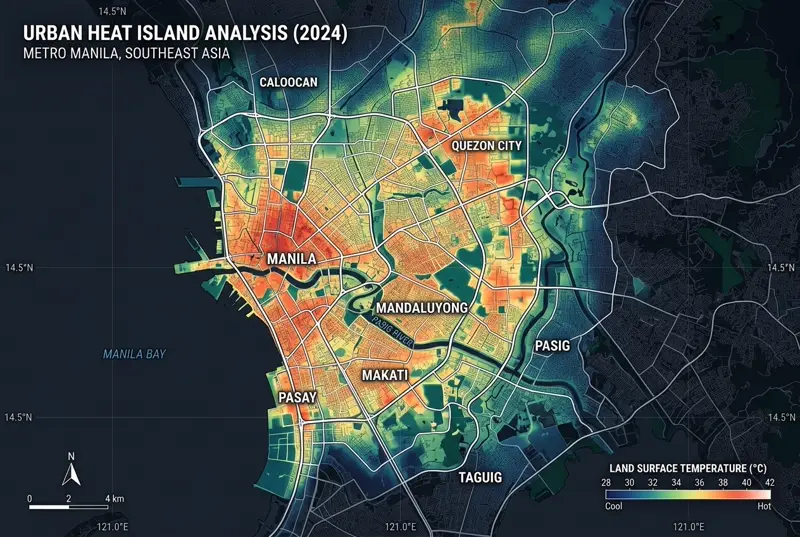
Understanding Urban Heat Island Effects with Landsat-8 Thermal IR & LST Mapping
Urban Heat Islands (UHI) represent one of the most critical environmental challenges facing modern megalopolises. As natural vegetation cover is replaced by impermeable concrete, asphalt, and high-density built structures, microclimatic thermal radiation increases significantly.
In this spatial research project, we derived Land Surface Temperature (LST) over two distinct metropolitan environments: Tokyo Bay Metropolitan Area and the Special Capital Region of Jakarta (DKI Jakarta), using multi-temporal Earth Observation satellite imagery.
Geospatial Methodology & Satellite Data Stack
To extract calibrated LST measurements at 30-meter spatial resolution, we utilized thermal infrared radiometry combined with multispectral vegetation indices:
- Landsat-8/9 TIRS (Thermal Infrared Sensor): Band 10 (10.60 – 11.19 µm) Top of Atmosphere (TOA) Spectral Radiance.
- Sentinel-2 MSI (Multi-Spectral Instrument): Band 4 (Red) and Band 8 (NIR) for high-resolution NDVI (Normalized Difference Vegetation Index) calculation.
- Copernicus Land Cover (10m): Impervious surface fraction masking.
Mathematical LST Extraction Equations
$$\text{TOA Radiance } L_\lambda = M_L \times Q_{cal} + A_L$$
$$\text{Brightness Temp } T_k = \frac{K_2}{\ln\left(\frac{K_1}{L_\lambda} + 1\right)}$$
$$\text{Land Surface Temp } LST = \frac{T_k}{1 + \left(\frac{\lambda \times T_k}{\rho}\right) \ln(\varepsilon)}$$
Where $\varepsilon$ is the land surface emissivity estimated from the Fractional Vegetation Cover ($P_v$).
Quantitative Spatial Findings
Our spatial overlay analysis across 4,200 km² of metropolitan area revealed significant microclimatic variation between high-density built environments and urban green infrastructure:
| District / Surface Category | Average LST (°C) | NDVI Range | UHI Thermal Anomaly (°C) |
|---|---|---|---|
| Industrial & Port Zone (Tokyo Bay / Tanjung Priok) | 36.4°C | 0.05 – 0.12 | +4.8°C (Extreme Heat) |
| High-Density Commercial CBD (Shinjuku / Sudirman) | 33.8°C | 0.10 – 0.20 | +3.2°C (High Heat) |
| Suburban Residential (Machida / Depok) | 29.5°C | 0.35 – 0.55 | +0.4°C (Moderate) |
| Major Urban Parks (Yoyogi Park / Monas Green Canopy) | 26.2°C | 0.65 – 0.82 | -2.8°C (Cooling Sink) |
Cartographic Recommendations for Urban Planners
- Targeted Green Roof Incentives: Priority intervention in industrial and commercial zones exhibiting $LST > 34^\circ\text{C}$ and $NDVI < 0.15$.
- Cooling Corridors: Aligning urban greenways along prevailing coastal breeze vectors to channel cooler maritime air inland.
- Albedo Materials: Substituting standard dark asphalt with high-albedo reflective paving, reducing surface absorption by up to 14%.
Data processed using QGIS, Google Earth Engine (GEE), and GDAL spatial libraries.