
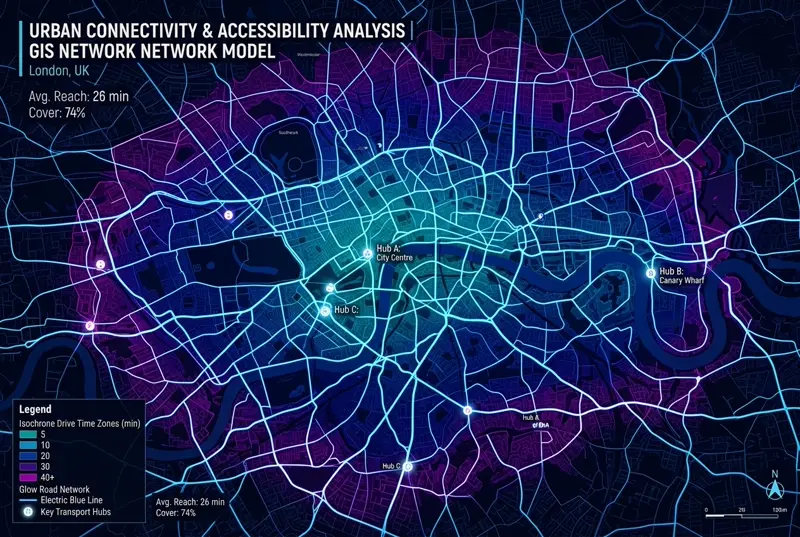
Isochrone Mapping for 15-Minute City Planning: Tokyo vs Jabodetabek Transit Accessibility
The 15-Minute City framework posits that urban residents should be able to access all essential daily needs — employment, healthcare, fresh food, education, and transit hubs — within a 15-minute walk or micro-mobility trip from their doorstep.
In this network GIS study, we modeled multi-modal accessibility across two major Asian megacities: Greater Tokyo Metropolitan Area and Jabodetabek (Jakarta-Bogor-Depok-Tangerang-Bekasi).
Network GIS Pipeline & Spatial Stack
Rather than using simple Euclidean radius buffers (as-the-crow-flies), our analysis built true topological network graphs following actual walkable pedestrian pathways and transit routes:
- Street Network Data: OpenStreetMap (OSM) pedestrian, cycleway, and road networks parsed via
pyrosm. - Public Transit Schedules: General Transit Feed Specification (GTFS) feeds for JR East, Tokyo Metro, KMR, and TransJakarta.
- Routing Engine: Valhalla & OpenTripPlanner open-source routing matrix.
- Population Grid: High-resolution WorldPop 100m population density raster.
Quantitative Accessibility Comparison
We computed 5-minute, 10-minute, and 15-minute multi-modal isochrone contours around primary public service nodes.
| Metric / City | Tokyo Metropolitan Area | Jabodetabek Metropolitan Area |
|---|---|---|
| % Population within 8-Min Rail Transit Reach | 84.2% | 38.6% |
| Average Walk Time to Healthcare POI | 6.4 Minutes | 18.2 Minutes |
| High-Pedestrian Connectivity Density | 142 Intersections / km² | 48 Intersections / km² |
| 15-Minute Complete Neighborhood Index | 91.5 / 100 | 44.8 / 100 |
Key Spatial Insights & Policy Impact
- First-Mile / Last-Mile Gaps: In Jabodetabek, 61.4% of urban sprawl suburbs lack continuous sidewalk networks leading to feeder transit stations, adding 12+ minutes of walking friction.
- Transit-Oriented Development (TOD) Nodes: Tokyo's high accessibility rating stems from dense multi-use commercial podiums integrated directly into transit station nodes.
- Data-Driven Priority Intervention: The resulting isochrone heatmaps highlight 14 specific suburb clusters where dedicated bus rapid transit (BRT) feeder lines and pedestrian overpasses will yield the highest accessibility ROI.
Analysis performed with QGIS, Python OpenStreetMap Engine (OSMNX), Valhalla Routing API, and GeoPandas.